Shopify A/B Testing Guide: 12 Tactics to Lift Conversions in 2026
Your Shopify store is getting traffic but not the sales you expected. Before you pour more budget into ads, you need to know what’s actually broken — and A/B testing is how you find out. According to VWO’s 2025 e-commerce benchmark report, stores that run structured A/B tests see an average conversion rate lift of 20–30% within six months. If your Shopify store converts at 1.5% and the industry average sits at 2.5–3.5%, structured testing is the fastest path to closing that gap.
This guide walks you through exactly how to run A/B tests on Shopify — from choosing the right tools and setting up experiments, to interpreting results and scaling winners. No theory, no filler — just the process that actually moves revenue.
- Which A/B testing tools work natively with Shopify in 2026 — and which ones slow your store down
- The highest-impact pages and elements to test first (with benchmark data)
- How to calculate statistical significance so you stop ending tests too early
- Step-by-step Shopify Admin paths for implementing winning variants
- Common A/B testing mistakes that invalidate your results — and how to avoid them
Why A/B Testing Is Non-Negotiable for Shopify Stores in 2026
Running a Shopify store on gut instinct in 2026 is expensive. Customer acquisition costs on Meta and Google have risen over 40% since 2022 (Wordstream, 2025), which means every percentage point of conversion rate is worth more than it used to be. A store doing $500K/year at 1.8% CVR that tests its way to 2.7% CVR effectively earns an extra $250K — with zero additional ad spend.
A/B testing removes the guesswork from your optimization decisions. Instead of debating whether your “Add to Cart” button should be green or black in a team Slack thread, you let your actual customers vote with their clicks. The result is a compounding improvement cycle: each winning test raises your baseline, making the next test even more valuable.
Shopify’s native platform doesn’t include a built-in A/B testing engine, which means you need third-party tools — and choosing the wrong one can tank your Core Web Vitals. More on tool selection in the next section.
The Best A/B Testing Tools for Shopify in 2026
Not all testing tools play nicely with Shopify’s Liquid architecture, Online Store 2.0 themes, or checkout extensibility. Here’s what actually works at each budget tier.
Google Optimize Alternatives (Post-Sunset)
Google Optimize was sunset in September 2023, and many Shopify merchants are still scrambling for a replacement. The strongest options right now are:
- Convert Experiences — The most Shopify-mature enterprise option. Flicker-free implementation, GA4 integration, and strong support for Online Store 2.0. Starts at ~$299/month.
- VWO (Visual Website Optimizer) — Excellent heatmaps, session recordings, and A/B testing in one suite. Pairs well with Hotjar data for pre-test research. Plans start at ~$199/month.
- Intelligems — Built specifically for Shopify. Tests prices, shipping thresholds, content, and themes natively without JavaScript injection. Plans start at $99/month and it’s the top recommendation for stores under $2M/year.
- Shoplift — A newer Shopify-native tool (2024) that tests entire theme sections using Shopify’s native rendering — zero flicker, zero speed impact. Strong for product page and collection page experiments.
- Optimizely — Enterprise-tier. If you’re doing $3M+ and have a developer, Optimizely gives you the most statistical rigor but requires significant setup investment.
Speed Impact: A Critical Consideration
Tools that inject JavaScript via a third-party CDN (like older versions of AB Tasty or Kameleoon without server-side implementation) can add 200–400ms of render-blocking latency. Google’s research shows that a 100ms delay in page load time reduces conversion rates by up to 7%. Always test your tool against PageSpeed Insights before committing to a paid plan.
The 12 Highest-Impact Elements to A/B Test on Your Shopify Store
Most Shopify merchants waste time testing low-impact elements (font size, background colors) before tackling the big levers. Prioritize by potential revenue impact, not by ease of setup.
1. Product Page Hero Section
The first viewport on your product page — including the primary image, product title, price display, and Add to Cart button — drives the majority of purchase decisions. Test: image style (lifestyle vs. white background), price anchoring (showing crossed-out compare-at price), and social proof placement (review stars above or below the title).
2. Add to Cart Button Copy and Color
Button copy matters more than color in most cases. “Add to Cart” vs. “Get Yours Now” vs. “Buy Now — Ships Today” can produce 10–25% CVR swings on high-intent product pages. In Shopify Admin, go to Online Store → Themes → Customize → Product Page to edit button text in theme settings, or edit product-form.liquid directly for full control.
3. Checkout Flow Entry Points
Shopify’s native checkout is highly optimized, but the path into checkout matters enormously. Test: cart drawer vs. cart page, single-step cart with express checkout buttons (Shop Pay, Apple Pay, Google Pay) vs. a standard cart review page. Stores that surface Shop Pay as the primary CTA report 18% higher checkout completion rates (Shopify, 2025).
4. Homepage Hero Banner
Your headline, sub-headline, and hero CTA determine whether new visitors stay or bounce. Test value proposition framing — benefit-led (“Sleep 2 hours more every night”) vs. product-led (“Our Signature Memory Foam Pillow”) vs. social-proof-led (“Trusted by 50,000 sleepers”).
5. Pricing Display and Anchoring
Intelligems specializes in price testing on Shopify. Test: showing monthly equivalents for high-ticket items (“Only $8.30/day”), bundle pricing, or tiered quantity discounts. Price anchoring — showing a higher “compare at” price — consistently lifts perceived value when the product genuinely merits it.
6. Product Photography Style
Lifestyle images outperform white-background studio shots for fashion, beauty, and home goods. The reverse is often true for electronics and tools. This is one of the most impactful tests you can run without changing any copy.
7. Trust Signals and Social Proof Placement
Test where you place review aggregates (Okendo or Judge.me star ratings), trust badges (secure checkout, free returns), and UGC. Above-the-fold trust signals typically outperform below-the-fold placement by 12–18% on first-visit sessions (Baymard Institute, 2024).
8. Navigation and Menu Structure
Mega-menus vs. simple dropdowns, the number of top-level categories, and whether to include a search bar prominently all affect discovery and time-on-site. Use Hotjar session recordings to identify where visitors drop off during navigation before designing your test variants.
9. Collection Page Filters and Sorting
Adding faceted filtering (by color, size, price, rating) on collection pages consistently improves add-to-cart rates for stores with 50+ SKUs. Test filter panel style: sidebar vs. horizontal top-bar filters.
10. Email Capture and Pop-Up Timing
Klaviyo’s pop-up timing, trigger logic (time-on-page vs. scroll depth vs. exit intent), and offer framing (“10% off” vs. “Free shipping on your first order”) are all testable. Exit-intent pop-ups typically convert at 4–7%, while time-triggered pop-ups (after 8 seconds) average 2–3% (Klaviyo, 2025).
11. Upsell and Cross-Sell Placement
Rebuy’s Smart Cart and product recommendations engine lets you A/B test upsell offers natively. Test: in-cart upsells vs. post-purchase upsells, AI-recommended products vs. manually curated bundles. Post-purchase upsells on Shopify’s thank-you page (now accessible via Shopify Functions) can add 8–15% to average order value.
12. Shipping Threshold Messaging
Test the free shipping threshold amount and how prominently you display progress toward it (e.g., “Add $12 more for free shipping” in the cart drawer). Stores that display dynamic shipping threshold progress bars report 12–20% higher AOV (Shopify App Store data, 2025).
A/B Testing Benchmarks: What Good Results Look Like on Shopify
| Page / Element Tested | Average CVR Lift (Winner) | Typical Test Duration | Minimum Traffic Required |
|---|---|---|---|
| Product Page CTA Copy | 10–25% | 2–4 weeks | 1,000 sessions/variant |
| Homepage Hero Headline | 5–20% | 2–3 weeks | 2,000 sessions/variant |
| Checkout Entry Point | 8–18% | 2–4 weeks | 500 transactions/variant |
| Price Display / Anchoring | 5–15% | 3–4 weeks | 1,500 sessions/variant |
| Email Pop-Up Offer | 15–40% | 1–2 weeks | 500 impressions/variant |
| Product Photography Style | 10–30% | 2–3 weeks | 1,000 sessions/variant |
| Shipping Threshold Banner | 12–20% AOV lift | 2–3 weeks | 1,000 sessions/variant |
| Trust Badge Placement | 5–12% | 2–4 weeks | 1,500 sessions/variant |
Source: Compiled from VWO e-commerce benchmarks (2025), Baymard Institute (2024), Intelligems internal data (2025), and Shopify Partner case studies.
How to Run a Proper A/B Test on Shopify: Step-by-Step
Most failed A/B tests aren’t failed because the hypothesis was wrong — they fail because the test was set up incorrectly. Follow this process every time.
- Define one clear hypothesis. Format: “Changing [element] from [control] to [variant] will increase [metric] because [reason based on data].” Example: “Changing the Add to Cart button copy from ‘Add to Cart’ to ‘Get Yours — Ships Today’ will increase product page CVR because it reduces friction by answering the most common pre-purchase question.”
- Identify your primary metric. Choose one: CVR, AOV, add-to-cart rate, email capture rate. Do not run a test optimizing for five metrics at once — you’ll get statistically meaningless results.
- Calculate your required sample size. Use a free tool like Evan Miller’s Sample Size Calculator. For a 95% confidence level with a 10% minimum detectable effect on a 2% baseline CVR, you need approximately 7,500 sessions per variant. Most Shopify stores under $200K/year will struggle to reach significance quickly — prioritize high-traffic pages.
- Set up your test in your chosen tool. In Intelligems: Go to your Intelligems dashboard → Create Experiment → Select experiment type (Content, Price, or Theme) → Define variants → Set traffic split (typically 50/50) → Set your goal metric → Launch.
- Let the test run to completion. Never end a test early because one variant is “winning.” You need both statistical significance (95%+) AND practical significance (the lift is large enough to matter to your business). A 0.1% CVR lift that’s statistically significant is not worth implementing.
- Analyze results in GA4. Use Google Analytics 4 → Explore → Funnel Exploration to verify that your winning variant’s lift holds across traffic segments (mobile vs. desktop, new vs. returning visitors). Segment-level analysis often reveals that a “winner” only wins on desktop — a critical distinction for a platform where over 70% of Shopify traffic is mobile (Shopify, 2025).
- Implement the winner. In Shopify Admin: Go to Online Store → Themes → Customize to apply theme-level changes, or work directly in the Liquid code at Online Store → Themes → Edit Code. Document every change in a testing log with the date, hypothesis, result, and implementation details.
- Move to the next test. Build a prioritized backlog using the ICE framework (Impact × Confidence × Ease, each scored 1–10). Always run your highest-ICE test next.
What Is A/B Testing for Shopify Stores? (A Clear Definition)
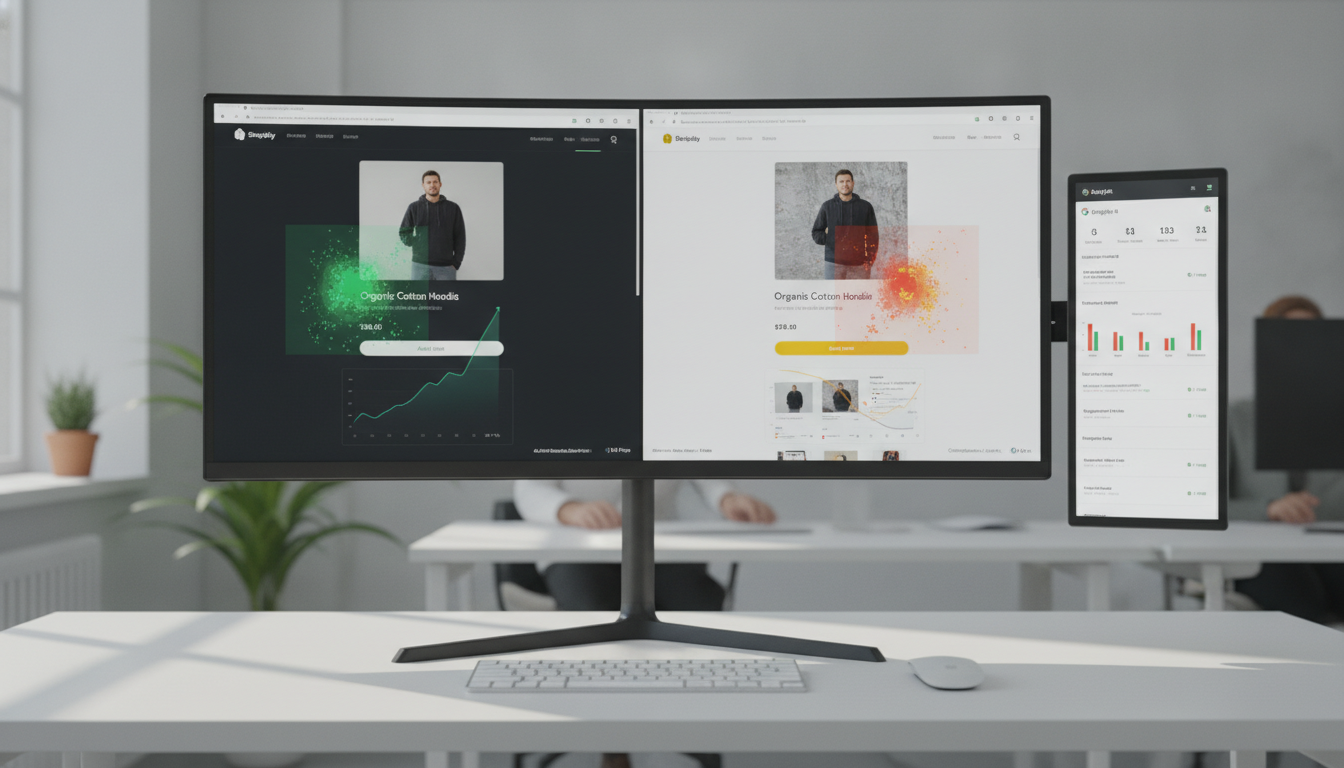
A/B testing on a Shopify store is a controlled experiment in which you show two or more versions of a page, element, or flow to different segments of your real traffic simultaneously — then measure which version produces better outcomes against a defined metric.
The “A” version is your control (what currently exists). The “B” version is your variant (the change you’re testing). Traffic is split — usually 50/50, though you can weight it differently when testing risky changes — and the experiment runs until you reach statistical significance.
What makes Shopify A/B testing distinct from testing on other platforms is Shopify’s architecture. The platform uses Liquid as its templating language, and Online Store 2.0 introduced a section/block-based structure that makes component-level testing easier than it used to be. However, Shopify’s hosted checkout (outside of Shopify Plus’s Checkout Extensibility) limits what you can test in the checkout flow without a Plus subscription.
On Shopify Plus, you can edit checkout.liquid (being deprecated in favor of Checkout Extensibility) and use Checkout UI Extensions to test payment method ordering, trust badges, upsell widgets, and field layouts within the native checkout. On standard Shopify plans, testing is limited to pre-checkout pages — product pages, collection pages, the cart, and the homepage.
A/B testing is not the same as multivariate testing (MVT), which tests multiple elements simultaneously. MVT requires exponentially more traffic to reach significance and is rarely practical for stores under $5M/year. Stick with clean A/B tests (one change at a time) until you have consistent traffic of 50,000+ monthly sessions.
The ultimate goal of A/B testing isn’t to win individual tests — it’s to build an organizational knowledge base about what your specific customers respond to. Every test, whether it wins or loses, teaches you something that makes the next test smarter.
How to Fix a Broken or Inconclusive A/B Test on Shopify
Inconclusive tests are the most common complaint from Shopify merchants who try A/B testing without a structured process. Here’s how to diagnose and fix the most common problems.
Problem 1: You Ended the Test Too Early
This is the single biggest mistake. A test that shows a 30% lift after three days with 200 sessions per variant is not trustworthy — that’s noise, not signal. The “peeking problem” — checking results daily and stopping when you see something exciting — inflates false positive rates to over 50% (Kohavi, Tang & Xu, “Trustworthy Online Controlled Experiments,” 2020). Set your test duration before launch and don’t touch it.
Problem 2: Traffic Was Split Across Too Many Variants
If you’re testing three or four variants simultaneously on a store with 10,000 monthly sessions, each variant gets roughly 2,500 sessions — likely not enough to reach significance in a reasonable timeframe. Limit yourself to two variants (control + one challenger) unless your traffic comfortably supports more.
Problem 3: External Events Contaminated Your Results
A flash sale, a viral social post, a PR mention, or a paid campaign targeting a different audience than your organic baseline will all skew your test results. If a major external event happens mid-test, pause the test, document the event, and restart cleanly. Use GA4’s annotation feature to mark external events on your data timeline.
Problem 4: Your Testing Tool Is Causing Flicker
Flicker happens when a visitor briefly sees the control version before the JavaScript swaps it to the variant. This means some visitors see both versions, contaminating your results and creating a poor user experience. Fix this by using server-side testing (Intelligems, Shoplift) or by implementing your testing tool’s anti-flicker snippet correctly above all other scripts in your theme’s <head> tag. Go to Online Store → Themes → Edit Code → layout/theme.liquid to adjust script load order.
Problem 5: You’re Measuring the Wrong Metric
If you’re running a product page test and measuring homepage bounce rate as your primary metric, you’ll get meaningless data. Match your metric to your hypothesis: product page tests → product page CVR or add-to-cart rate. Homepage tests → session duration, pages per session, or first-product-view rate. Cart tests → checkout initiation rate. Always set your goal metric in your testing tool before you launch.
Problem 6: Your Segments Are Mixed
If 40% of your test traffic is mobile and your variant was designed for desktop, your overall result will be a blended average that understates mobile performance. Always segment your results by device type in GA4 after a test concludes. Use GA4 → Explore → Free-form report with device category as a dimension to break down variant performance by mobile, tablet, and desktop.
Why A/B Testing Results Often Don’t Transfer to Revenue Gains
This is the question most Shopify testing guides ignore: why does a test sometimes show a statistically significant conversion lift but produce no meaningful revenue increase after implementation?
The answer is almost always one of three things: novelty effect, segment mismatch, or the wrong primary metric.
Novelty effect occurs when visitors respond positively to a change simply because it’s different from what they previously saw — not because it’s genuinely better. This is especially common with visual changes like new hero images or redesigned product layouts. The lift fades within 2–4 weeks as returning visitors normalize the new experience. To detect novelty effect, segment your test results by new vs. returning visitors. If returning visitors drive most of the lift and new visitors show no improvement, you’re looking at novelty, not real optimization.
Segment mismatch happens when your test is won by a segment that isn’t representative of your highest-value customers. A price anchoring test might lift CVR among discount-hunters while reducing AOV and LTV. Always connect your testing data to Klaviyo’s customer profiles or Shopify’s customer analytics to verify that your winning variant’s customers aren’t disproportionately low-LTV buyers.
Wrong primary metric is the most correctable problem. CVR is an incomplete metric — a pop-up that captures email addresses at a 15% rate but annoys visitors enough to reduce purchase CVR by 2% is a net negative. Always calculate revenue per visitor (RPV) as your north-star metric. RPV = (Total Revenue) ÷ (Total Visitors) for each variant. This accounts for both conversion rate and order value simultaneously, giving you a single number that ties directly to your bottom line.
In Shopify’s analytics, go to Analytics → Reports → Sales by traffic referrer and cross-reference with your testing tool’s segment data to calculate RPV per variant. Most enterprise testing platforms (Convert, VWO, Optimizely) calculate RPV natively in their dashboards.
How to Prevent Wasted A/B Tests and Build a System That Compounds
The difference between Shopify stores that get compounding gains from A/B testing and those that spin their wheels is a repeatable system — not better ideas.
Build a Testing Backlog Before You Run a Single Experiment
Before launching any test, spend two weeks in research mode. Use Hotjar heatmaps and session recordings to identify where visitors click, scroll, and abandon. Use GA4’s Funnel Exploration to map your conversion funnel and find the steps with the highest drop-off rates. Use Klaviyo’s email response data to identify which subject lines and offers resonate most. Pull your Shopify store’s customer Q&A and review data from Okendo to find recurring objections. Every piece of research should generate a hypothesis that goes into your testing backlog.
Score Every Hypothesis Before Committing Resources
Use the ICE framework: Impact (how much could this move your north-star metric, 1–10?), Confidence (how strong is the supporting evidence, 1–10?), Ease (how easy is implementation, 1–10?). Average the three scores and rank your backlog. Always run the highest-scoring test next, regardless of personal preference or stakeholder pressure.
Document Everything — Especially Losses
A test that doesn’t produce a winner is not a failure — it’s data. A failed test eliminates a hypothesis you might otherwise have revisited in six months. Keep a testing log in Notion or Google Sheets with: test name, hypothesis, variant description, start/end date, traffic volume, result (winner/loser/inconclusive), statistical significance, key learnings, and next action. Over time, patterns emerge: your audience prefers direct copy over clever headlines, or lifestyle images outperform studio shots 4:1, or free shipping beats percentage discounts. These patterns are your store’s conversion intelligence.
Establish a Testing Cadence
Aim for one concluded test every 2–3 weeks. That’s 18–26 tests per year — enough to produce meaningful compounding improvements. Stores that run fewer than 6 tests per year rarely see sustained CVR gains because each individual test’s lift is too small to be transformative in isolation.
Integrate Testing With Your Marketing Calendar
Pause active tests during major sales events (Black Friday, Cyber Monday, seasonal promotions). Your BFCM traffic is demographically different from your year-round audience — running tests during that window produces data that doesn’t generalize. Use those high-traffic periods to run “pulse tests” on your final BFCM landing pages instead, keeping your core optimization tests separate.
Shopify A/B Testing Mistakes That Kill Your Data Integrity
Beyond the fixes covered above, here are the mistakes that specifically damage data quality on Shopify stores:
- Testing during theme updates: If your developer pushes a theme change mid-test, the control and variant are no longer isolated. Freeze theme code during active tests.
- Running overlapping tests on the same page: Two simultaneous tests on the product page interact with each other and produce interaction effects. Use a testing tool with mutual exclusion settings to prevent this.
- Ignoring mobile separately: With 70%+ of Shopify traffic on mobile, a test that performs well on desktop but poorly on mobile is a loser. Always check mobile-specific results before implementing.
- Using Shopify’s built-in “duplicate theme” as a test: Some merchants manually create a duplicate theme, split traffic with a redirect, and call it an A/B test. This approach doesn’t ensure proper traffic randomization, doesn’t account for returning visitors (who may see both versions), and can’t attribute conversions accurately. Use a dedicated testing tool.
- Testing page elements without fixing technical issues first: If your store has Core Web Vitals failures (check with PageSpeed Insights), fix those before optimizing copy and imagery. A 4-second LCP will suppress CVR regardless of how good your headline is.
Shopify A/B Testing in 2026: The Bottom Line
A/B testing is one of the highest-leverage activities available to a Shopify store owner — but only when it’s done with the right tools, the right process, and the right metrics. The stores winning on Shopify in 2026 aren’t the ones with the biggest ad budgets; they’re the ones who have built systematic, data-driven optimization machines. Start with Intelligems or Shoplift if you’re under $2M/year. Use Hotjar and GA4 for pre-test research. Score your hypotheses with ICE, measure revenue per visitor as your north-star metric, and never end a test before you hit statistical significance. Run one concluded test every 2–3 weeks, document every result, and let the compounding gains do the work over the next 12 months.