Shopify A/B Testing: 12 Proven Tactics to Lift Conversions (2026)
Your Shopify store is getting traffic but the revenue isn’t moving. You’ve tweaked the homepage banner, changed a button color, and still nothing. The problem isn’t your product — it’s that you’re guessing instead of testing. According to VWO’s 2025 Conversion Benchmark Report, stores that run structured A/B tests see an average 23% lift in conversion rate within 90 days — but fewer than 12% of Shopify merchants run even one test per quarter.
This guide gives you a complete, repeatable system for A/B testing on Shopify — from picking the right tool to reading results without fooling yourself with bad data.
- The highest-ROI A/B tests on Shopify target product pages, checkout flow, and homepage hero sections — in that order.
- You need a minimum of 1,000 unique visitors per variant and statistical significance above 95% before calling a winner.
- Google Optimize’s sunset means most Shopify merchants should now be on Convert Experiences, Intelligems, or Neat A/B Testing.
- Testing without a hypothesis is the single biggest reason merchants waste months on inconclusive results.
- Mobile and desktop should be analyzed as separate segments — a winning variant on desktop frequently loses on mobile.
Why Most Shopify A/B Tests Produce Useless Data
Before you run a single test, understand the most common failure mode: running tests without enough traffic. If your store gets 800 sessions a month, splitting that between two variants gives you 400 sessions each. At a 2% baseline conversion rate, that’s 8 conversions per variant — statistically meaningless.
The second failure mode is testing too many variables at once. Changing your headline, hero image, and button color in the same test makes it impossible to know what drove the result. Each test should isolate exactly one variable.
The Minimum Traffic Requirement
Use a sample size calculator (Evan Miller’s free tool at evanmiller.org is the industry standard) before launching any test. Input your baseline conversion rate and your minimum detectable effect — the smallest improvement worth acting on. Most Shopify stores need between 1,000 and 2,000 visitors per variant to detect a 10–15% relative improvement with 95% confidence.
If you don’t have that traffic, you have two options: run tests sequentially on your highest-traffic pages only, or invest in paid traffic to reach significance faster.
Setting a Proper Hypothesis
Every test needs a structured hypothesis: “Because [data insight], changing [element] to [new version] will [expected outcome] for [audience segment].” For example: “Because Hotjar heatmaps show 68% of mobile users don’t scroll past the fold, replacing our text-heavy hero with a single benefit statement and CTA will increase add-to-cart rate for mobile visitors.”
This format forces you to tie every test to real behavioral data, not hunches.
The Right Shopify A/B Testing Tools for 2026
Google Optimize shut down in September 2023, which left a gap many merchants still haven’t properly filled. Here’s where the market stands in 2026:
| Tool | Best For | Monthly Cost (USD) | Shopify Native? | Statistical Model |
|---|---|---|---|---|
| Intelligems | Price testing, content tests | $149–$499 | Yes (App Store) | Frequentist + Bayesian |
| Convert Experiences | Advanced multi-page tests | $299–$699 | Via JS snippet | Frequentist |
| Neat A/B Testing | Small-to-mid stores, theme tests | $49–$149 | Yes (App Store) | Bayesian |
| Shoplift | Section-level theme testing | $99–$299 | Yes (App Store) | Bayesian |
| VWO | Enterprise, funnel testing | $700+ | Via JS snippet | Frequentist + SmartStats |
For most Shopify stores doing $50K–$1M/year, Intelligems or Shoplift offer the best balance of power and ease of use. Intelligems is particularly strong if you want to test pricing — a capability most tools don’t support natively on Shopify.
12 High-Impact A/B Tests to Run on Your Shopify Store
1. Product Page Hero Image vs. Lifestyle Image
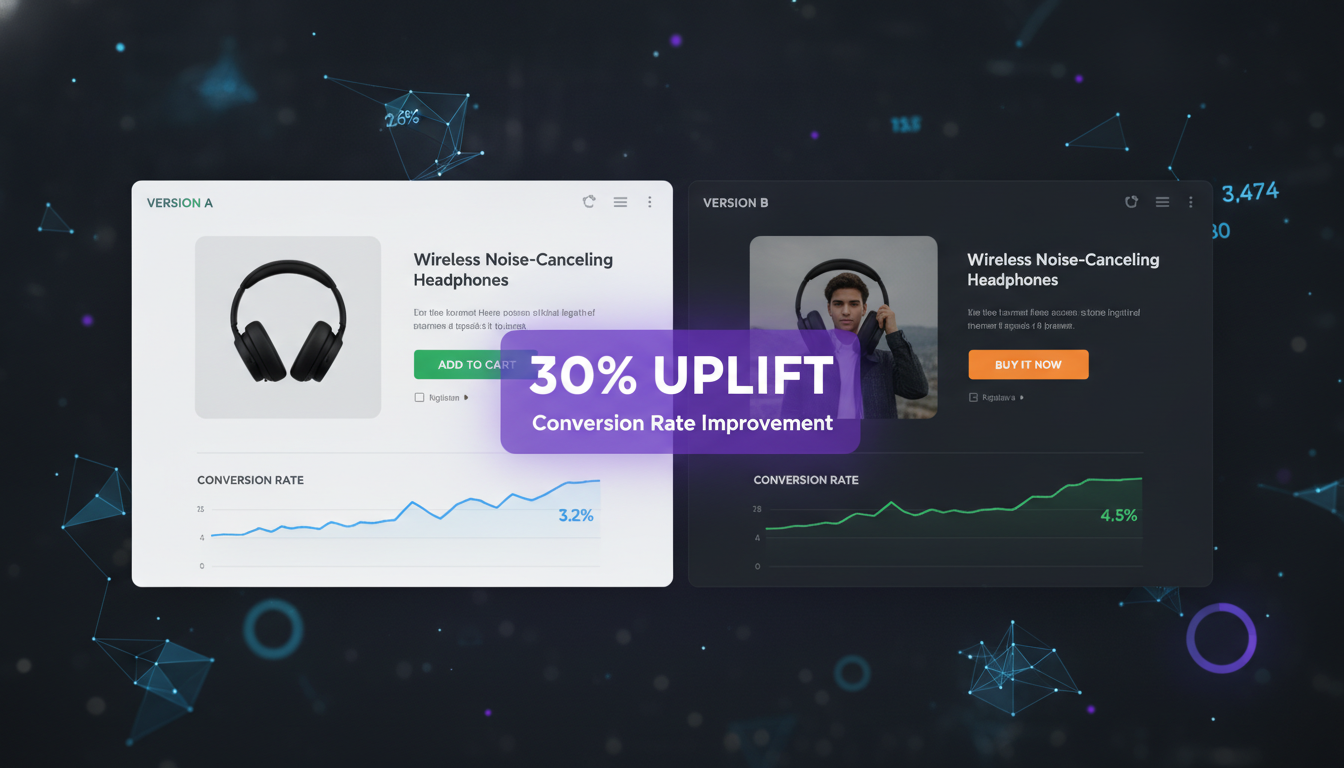
Studio product shots communicate clarity; lifestyle images communicate aspiration. Neither is universally better — it depends on your category. Test them. Fashion and home decor brands typically see 8–15% add-to-cart lifts from lifestyle imagery, while electronics and supplements often perform better with clean studio shots that emphasize product detail.
2. Single-Column vs. Two-Column Product Description Layout
Most Shopify themes default to a two-column layout (image left, details right). For high-consideration products with long descriptions, a single-column narrative layout can increase time-on-page and conversion. Run this on your top three revenue-driving products first.
3. CTA Button Copy
“Add to Cart” is the default. Test it against “Buy Now,” “Get Yours,” or benefit-led copy like “Start My Free Trial.” Button copy changes are low-effort, high-signal tests that routinely produce 5–20% swings in click-through rate. Access your theme editor via Shopify Admin → Online Store → Themes → Customize → Product pages to edit button labels without touching code.
4. Sticky Add-to-Cart Bar on Mobile
On mobile, your primary CTA disappears the moment a user scrolls. A sticky bar that follows the user down the page keeps the conversion action visible. Tools like Shoplift let you A/B test this as a section toggle. Expect 6–12% improvement in mobile add-to-cart rates based on 2025 data from Shoplift’s aggregate customer results.
5. Social Proof Placement — Above vs. Below the Fold
Most themes place star ratings directly under the product title, but review snippets and UGC often get buried below the fold. Test surfacing your highest-impact review quote directly above the Add to Cart button. Okendo’s 2025 platform data shows that inline review quotes near the CTA increase conversion by an average of 11% compared to reviews displayed only at page bottom.
6. Pricing Display — Strikethrough vs. Percentage Savings
Showing “$120 $80” and showing “$80 (33% off)” communicate the same discount differently. The percentage format tends to outperform for discounts under 30%; the strikethrough dollar format tends to win for larger absolute savings. Test both on your sale collection pages.
7. Free Shipping Threshold Messaging
If you offer free shipping at a certain cart value, the placement and phrasing of that message matters enormously. Test a dynamic cart progress bar (“Add $12.50 more for free shipping”) against a static banner. Rebuy’s Smart Cart feature supports this natively. Dynamic progress bars consistently outperform static banners by 15–25% in average order value lift according to Rebuy’s 2025 merchant data.
8. Homepage Hero — Offer-Led vs. Brand-Led
A brand-led hero leads with your story or aesthetic. An offer-led hero leads with a specific product or promotion. For stores under $500K/year, offer-led heroes almost always win on direct conversion metrics. Test the headline, subheadline, and primary CTA as a single combined variant — don’t test each element individually at this level of traffic.
9. Navigation — Mega Menu vs. Simple Dropdown
Complex navigation can overwhelm new visitors. Test a simplified navigation that surfaces your top three categories against your current mega menu. Use Hotjar session recordings to see where users are dropping off in your current nav before you design your variant.
10. Product Recommendations — Manual vs. AI-Powered
Manually curated “You May Also Like” sections are static and stale. Rebuy’s AI-powered recommendation engine tests personalized recommendations against your static picks. Merchants switching from static to Rebuy’s dynamic recommendations report a median 12% increase in revenue per session, per Rebuy’s 2026 ROI report.
11. Checkout — One-Page vs. Multi-Step
Shopify’s native one-page checkout (introduced in 2023 and refined significantly through 2025) is now the default for most themes. If you’re still running a three-step checkout, test switching immediately. Navigate to Shopify Admin → Settings → Checkout → Customer experience to enable one-page checkout. Shopify’s own data shows a 25–35% reduction in checkout abandonment after switching to one-page checkout.
12. Email Capture — Popup Timing (3 seconds vs. Exit-Intent)
Early popups interrupt browsing; exit-intent popups catch visitors leaving. Test both for email capture rate and downstream revenue per subscriber. Use Klaviyo’s built-in form A/B testing or a dedicated tool like Privy to run this test. Exit-intent typically captures fewer subscribers but with higher purchase intent — and those subscribers convert at 2–3x the rate of early-popup subscribers, per Klaviyo’s 2025 Email Benchmarks Report.
How to Read Your A/B Test Results Without Getting Fooled
The most dangerous number in A/B testing is a result with 85% statistical significance that you call early because the variant is “clearly winning.” Peeking at results before reaching your pre-determined sample size inflates false positive rates dramatically. A 2024 study in the Journal of Marketing Analytics found that merchants who called tests early based on 85% confidence were wrong about the true winner more than 40% of the time.
Set your test duration before launch — typically 2–4 weeks to account for day-of-week traffic variation — and don’t touch it until it’s over. Use your A/B testing tool’s built-in significance calculator, but also segment results by device type, traffic source, and new vs. returning visitors before implementing a winner.
Segmenting Results by Device
A variant that wins overall can be masking a loss on mobile. Connect your A/B testing tool to Google Analytics 4 via UTM parameters or a direct integration (Convert Experiences and VWO both support native GA4 integration). In GA4, create a custom segment for each variant and filter by device category. This 10-minute analysis step prevents you from rolling out a change that hurts your mobile majority.
What to Do After a Test Concludes
- Document the result — hypothesis, variant description, sample size, confidence level, and revenue impact — in a shared test log (a simple Notion database works well).
- If the variant wins, implement it in your live theme via Shopify Admin → Online Store → Themes → Customize, then archive the test.
- If the test is inconclusive, diagnose whether you had insufficient traffic, a weak hypothesis, or a flawed implementation — then decide whether to re-run or move on.
- If the control wins, that’s still a valid result — document what didn’t work so you don’t repeat the same test.
How to Test if Your Shopify Store Works?
This question usually comes from merchants who’ve launched a new store or made significant changes and want to verify that everything functions correctly before driving paid traffic. “Works” has two dimensions: technical functionality and conversion readiness.
For technical functionality, run through this checklist manually and with tools:
- Checkout flow: Place a real test order using a real payment method, then immediately refund it. Go to Shopify Admin → Orders and confirm the order appeared correctly with all line items, shipping rates, and discount codes applied. Then test with Shopify’s Bogus Gateway (Settings → Payments → Manage → Use Test Mode) to simulate failures.
- Mobile rendering: Use Google’s Mobile-Friendly Test (search.google.com/test/mobile-friendly) and physically test on iOS Safari and Android Chrome — emulators miss real-device rendering issues.
- Page speed: Run every key page (homepage, top collection, top product, cart) through PageSpeed Insights (pagespeed.web.dev). Target a Largest Contentful Paint (LCP) under 2.5 seconds and a Cumulative Layout Shift (CLS) score under 0.1. Stores with LCP above 4 seconds see a 24% higher bounce rate on mobile, per Google’s 2025 Core Web Vitals report.
- Email flows: Trigger your Klaviyo welcome flow and abandoned cart sequence with a test email address to confirm they fire correctly, render on mobile, and contain accurate product data.
- Analytics tracking: Verify Google Analytics 4 is receiving events by going to GA4 → Reports → Realtime while browsing your store. Confirm purchase events are firing by completing a test transaction and checking GA4 within 5 minutes.
- Broken links: Use Screaming Frog (free up to 500 URLs) to crawl your store and flag any 404 errors, redirect chains, or missing meta descriptions.
For conversion readiness, install Hotjar (free tier supports up to 35 sessions/day with heatmaps) and watch at least 20 session recordings after your first 200 visitors. Look for rage clicks, scroll depth drop-offs, and form abandonment patterns. These observations become your first wave of A/B test hypotheses.
Finally, validate your store’s trust signals: visible return policy link in the footer, SSL padlock (confirmed via your browser address bar), customer reviews on product pages, and a populated About page. Baymard Institute’s 2025 UX research found that 17% of users abandoned checkout specifically because they didn’t trust the store with their payment information. These are fixable problems that testing alone won’t solve.
Why Do 90% of People Doing Shopify with FB Ads Fail?
The “90% failure” figure is commonly cited in Facebook ads communities and it’s directionally accurate, though the real number varies by data source. Meta’s own SMB advertiser data from 2024 suggests that approximately 76% of new direct-to-consumer advertisers on Meta fail to achieve a positive return on ad spend (ROAS) within their first 90 days. The reasons are structural, not random.
The first and most common failure is sending paid traffic to an unconverted store. A store converting at 0.8% (below-average for DTC) requires a cost-per-click of under $0.40 to be profitable at a $50 AOV with 40% margins. That’s essentially impossible in 2026’s Meta auction environment, where CPCs in most consumer categories range from $1.50 to $4.00. You must optimize your store’s conversion rate before scaling paid traffic — not after.
The second failure is incorrect campaign structure. Many beginners run one campaign with one ad set and three creatives, then judge the channel as “not working” after spending $200. Meta’s algorithm needs roughly 50 conversion events per ad set per week to exit the learning phase and begin optimizing effectively. At a 2% conversion rate and a $30 CPC, that’s $750 in spend just to exit learning on a single ad set. Most beginners don’t have the budget or the patience for this, and they pull the plug too early.
The third failure is creative. Meta’s 2025 creative performance data shows that the top 10% of performing creatives account for 80% of conversions. Most beginners test two or three creatives. High-performing advertisers test 10–20 creatives per month, identify winners quickly, and ruthlessly kill losers.
The fourth failure is attribution confusion. iOS 14.5+ tracking changes, which have compounded through 2025 policy updates, mean that Meta’s reported ROAS is routinely 20–40% overstated or understated depending on your setup. Stores that don’t use server-side conversion API (Shopify natively supports Meta CAPI via Settings → Customer events → Meta Pixel) are flying blind. Set up CAPI before spending a single dollar on Meta ads.
The merchants who succeed with Meta + Shopify share three traits: a store converting above 2.5%, a willingness to spend $1,500–$3,000 in testing budget before expecting profitability, and a creative production system that generates fresh content weekly.
What Is the $200 Threshold on Shopify?
The “$200 threshold” most commonly refers to Shopify’s fraud analysis payout threshold for high-risk orders — but it’s frequently confused with several different Shopify-specific $200 limits, so let’s clarify all of them.
1. Shopify Balance Payout Threshold: Shopify Balance accounts (Shopify’s built-in business banking product) do not have a standard $200 threshold for payouts, but some merchants encounter a $200 minimum for certain wire transfer features depending on their account tier and region. This is account-specific and visible in your Shopify Admin → Finances → Balance.
2. Shopify Fraud Filter Threshold: Within Shopify’s built-in fraud analysis, orders above a certain value — which you can configure — are automatically flagged for review. Many merchants and third-party guides cite $200 as a common default threshold for triggering manual order review, though this is configurable. Navigate to Shopify Admin → Settings → Payments → Fraud prevention to set your own order review thresholds.
3. Shopify Capital Threshold: Shopify Capital offers merchant cash advances and loans. There is no universal $200 minimum, but early-stage capital offers often start at small amounts — sometimes as low as $200 in test markets — before scaling with your store’s GMV history.
4. Advertising Context (Meta/Google): In Facebook and Google ads communities, the “$200 rule” is a merchant-developed rule of thumb — not an official Shopify policy — suggesting you spend at least $200 in testing budget per ad set before evaluating performance. This is a budgeting heuristic, not a Shopify platform feature.
If you encountered the “$200 threshold” in a specific context — a Shopify notification, a third-party app, or an ads training course — the meaning differs by source. The most actionable advice: check your Shopify Admin → Finances and Settings → Payments to understand any platform-level thresholds that apply to your specific account and plan.
Is Shopify Still Worth It in 2026?
Shopify processed over $300 billion in GMV in 2025, making it the largest hosted commerce platform in the world by merchant volume. The short answer is yes — for most DTC and B2C brands doing up to $50M/year, Shopify remains the most mature, most extensible, and most conversion-optimized platform available.
But “worth it” depends heavily on your situation. Here’s an honest breakdown:
Shopify is clearly worth it if:
- You’re launching a new DTC brand and want to move fast — Shopify’s setup time is measured in days, not weeks.
- You’re doing $50K–$5M/year and want a stable, well-supported platform with a massive app ecosystem (10,000+ apps as of 2026).
- You need omnichannel — Shopify’s POS, Buy Button, and native social commerce integrations (TikTok Shop, Instagram, Pinterest) are best-in-class.
- You want access to Shopify Payments, which eliminates third-party payment gateway fees and offers competitive rates starting at 2.4% + $0.00 on Shopify Advanced.
Shopify may not be the right fit if:
- You’re building a highly complex B2B operation with custom pricing per account, complex quote workflows, and ERP-level inventory management — Shopify Plus addresses some of this, but Salesforce Commerce Cloud or BigCommerce B2B Edition may serve you better above $50M GMV.
- You have extreme customization needs that require deep database access — Shopify’s architecture is intentionally constrained, and some custom development requirements hit hard limits that headless builds (using Shopify’s Storefront API with a Next.js frontend) can solve but at significant cost.
- Your margins are razor-thin and every basis point of transaction fee matters — Shopify’s 0.5–2% transaction fee (waived with Shopify Payments) adds up at high volumes if you must use a third-party gateway.
The 2026 competitive picture has Shopify facing credible competition from WooCommerce (for cost-conscious operators who own their stack), BigCommerce (for mid-market and B2B), and emerging headless platforms. But Shopify’s 2025 investment in AI-powered features — including Sidekick (their AI merchant assistant), AI-generated product descriptions, and Shopify Magic for media editing — has meaningfully widened the capability gap for solo operators and lean teams.
For any brand under $10M/year, the combination of Shopify’s platform stability, Checkout extensibility (introduced properly in Shopify Functions), and ecosystem depth makes it the default right answer in 2026. The real question isn’t whether to use Shopify — it’s whether you’re using it well.
Building a Repeatable A/B Testing Program on Shopify
Running one test is a tactic. Running 24 tests per year is a competitive advantage. The difference is a system.
Your Monthly Testing Calendar
Structure your testing program around a four-week sprint: Week 1 — analyze data from Hotjar, GA4, and Klaviyo to generate hypotheses. Week 2 — design and QA two to three new test variants. Weeks 3–4 — run live tests while monitoring for technical issues. Repeat.
Prioritize your test backlog using the ICE framework (Impact × Confidence × Ease, each scored 1–10). Tests with the highest composite score run first. This prevents you from spending two months testing button colors when your checkout flow has a documented 78% abandonment rate.
Connecting Test Results to Revenue
Every test should map back to a revenue metric. In Intelligems, you can directly compare revenue per visitor between variants — which is far more meaningful than conversion rate alone because it accounts for AOV differences between variants. A variant with a 0.2% lower conversion rate but a $15 higher AOV can be the clear revenue winner.
In GA4, create a custom event for each experiment variant using the experiment_id and variant_id parameters, then build an Explorations report that shows purchase revenue segmented by variant. This gives you a platform-agnostic revenue view that survives tool changes.
The Compounding Effect of Systematic Testing
A single A/B test that lifts conversion rate by 10% is meaningful. Twelve tests per year, each producing a 5–10% improvement on different parts of your funnel, compounds into a store that converts at 40–80% above where it started. That’s the difference between a store doing $800K/year and a store doing $1.3M/year on the same traffic budget. The math is straightforward; the discipline is the hard part.
Start with your highest-traffic page, build one clear hypothesis based on real behavioral data from Hotjar or GA4, run the test to statistical significance, document the result, and move to the next. That loop — repeated consistently — is how category-leading Shopify brands are built in 2026.